Disclaimer
Last Week’s Data
Lots of data was published this week which were major market movers.
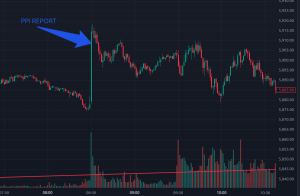
Producer Price Index(PPI)
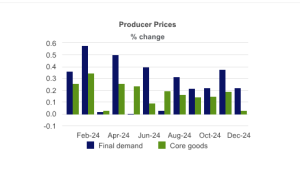
Once this report came out, the market reacted very positively, which was a first glimpse of the massive rally coming for this week.
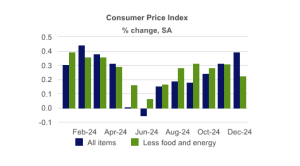
Consumer Price Index(CPI)
Definition: The consumer price index is a measure of the average change over time in the prices paid by urban consumers for a fixed market basket of consumer goods and services. The CPI provides a way for consumers to compare what the market basket of goods and services costs this month with what the same market basket cost a month or a year ago.
CPI is one of the main economic indicators the Federal Reverse uses to gauge interest rate policy.
The main takeaway is Core CPI, which removes the volatile sectors of food and energy, has actually reduced down to 0.2% instead of 0.3%. Core CPI, excluding food and energy, rose 0.2%, breaking a streak of 0.3% gains and lowering the 12-month rate to 3.2% from 3.3%. Shelter inflation was mild again in December, which lowered the year-ago rate from 4.7% to 4.6%. This is GREAT news for the Fed! The high interest rates policy is finally showing a slowdown in inflation.
Once this report came out, we launched higher right out of the gate. From PPI, we had a feeling this might happen, and our gut was right.
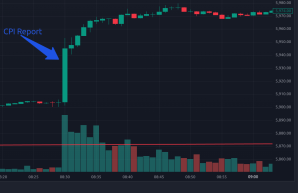
The market rallied about 50 points in one minute, that is a $2,500 dollar move for on $ES contract. Throughout the entire day on Wednesday, Jan 15th, the market continued to rally, ending the day about up 100 points, or 1.85% gain. This was the main takeaway of the next trend coming up in the next couple of weeks.
Overall Market Update
We have broken out of a downtrend last week. Market is positioned long, and we’re most likely going to see ATHs in the coming weeks. The most important number to come out are the GDP numbers in two weeks. Those numbers will show us how stocks will perform in Feb/March.
We have broken out of the downtrend line on the daily chart, noted on the green line in this chart.
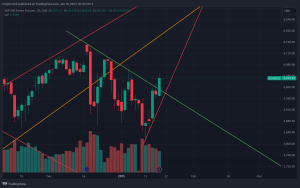
As long as the market holds above that green line, my gut is telling me we will see ATHs in the coming weeks targeting 6200. The perfect setup this week, would have the market back-test the 6000 breakout, and rally off of that to 6100’ish. I would love to re-buy 6000 and ride it to around 6100.
If 6000 fails, the entire move will reverse back to the downside.
The market is going to ride the momentum from the CPI to 6200 is my bottom line. As long as no external factors come into play from headline news, we are on the way to new highs up until the GDP report.
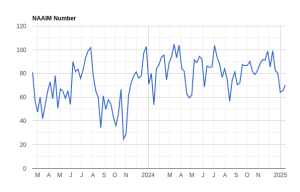
However, funds are getting back long.
By looking into the NAAIM index, The NAAIM Exposure Index represents the average exposure to US Equity markets. The NAAIM for this week was 70.21!
About Me
Thanks for reading my posts. My name is Chris, and I am a Software Engineer with a bachelor’s, master’s in Computer Science and with an MBA in Finance. I have been involved in the financial markets for over 7 years now, writing my own algorithms that trade for me, and provide me with signals to act on.
I am a principal at StockOrbit Securities, and have my Series 3.
StockOrbit Securities is a CTA that helps clients manage their funds. Not sure what to do in these markets? Reach out to support@stockorbit.app!